In this article, you'll learn about the reports module and how to track your business activities in real time and analyze performance with reports.
Introduction
Gain valuable data-driven insights into your business's performance, track financials, appointments, and client engagement. The Reports module consolidates essential metrics, empowering you to make informed decisions, optimize operations, and achieve business growth. Stay on top of key performance indicators, understand client preferences, and easily tailor your strategies. Maximize the potential of your platform account and boost your success using the comprehensive features of the Reports module.
Getting Started With Reports
To open the Reports module, click ’Reports’ in the Main menu.
Note: Reports are not included by default in all accounts. Contact Support or the Customer Success team if you can’t see or access the reports module.
On the main page, reports are categorized into five main categories:
- Bookings
- Payments
- Clients
- Marketing
- Staff
In each category, you can see the name of the report and the description of what it refers to and analyzes.
There are two types of report visualizations,
table, which is represented by the following icon , or a chart icon
respectively.
Note: Reports data refreshes once a day. For the most accurate data, view reports for the previous day and earlier only.
Filtering, sorting, and drill down
Each report has a filtering capability based on the metrics that are relevant to the specific report. All available filters will show above the report.
All reports include a date filter you can use to set the date ranges for the report. You can choose from preset date ranges or set a custom date range.
Click on row headings to sort by ascending or descending order.
You can also drill down by clicking on rows with report statistics.
Bookings Reports
The Booking reports will give you a bird's eye view of the performance of your events, appointments, and services.
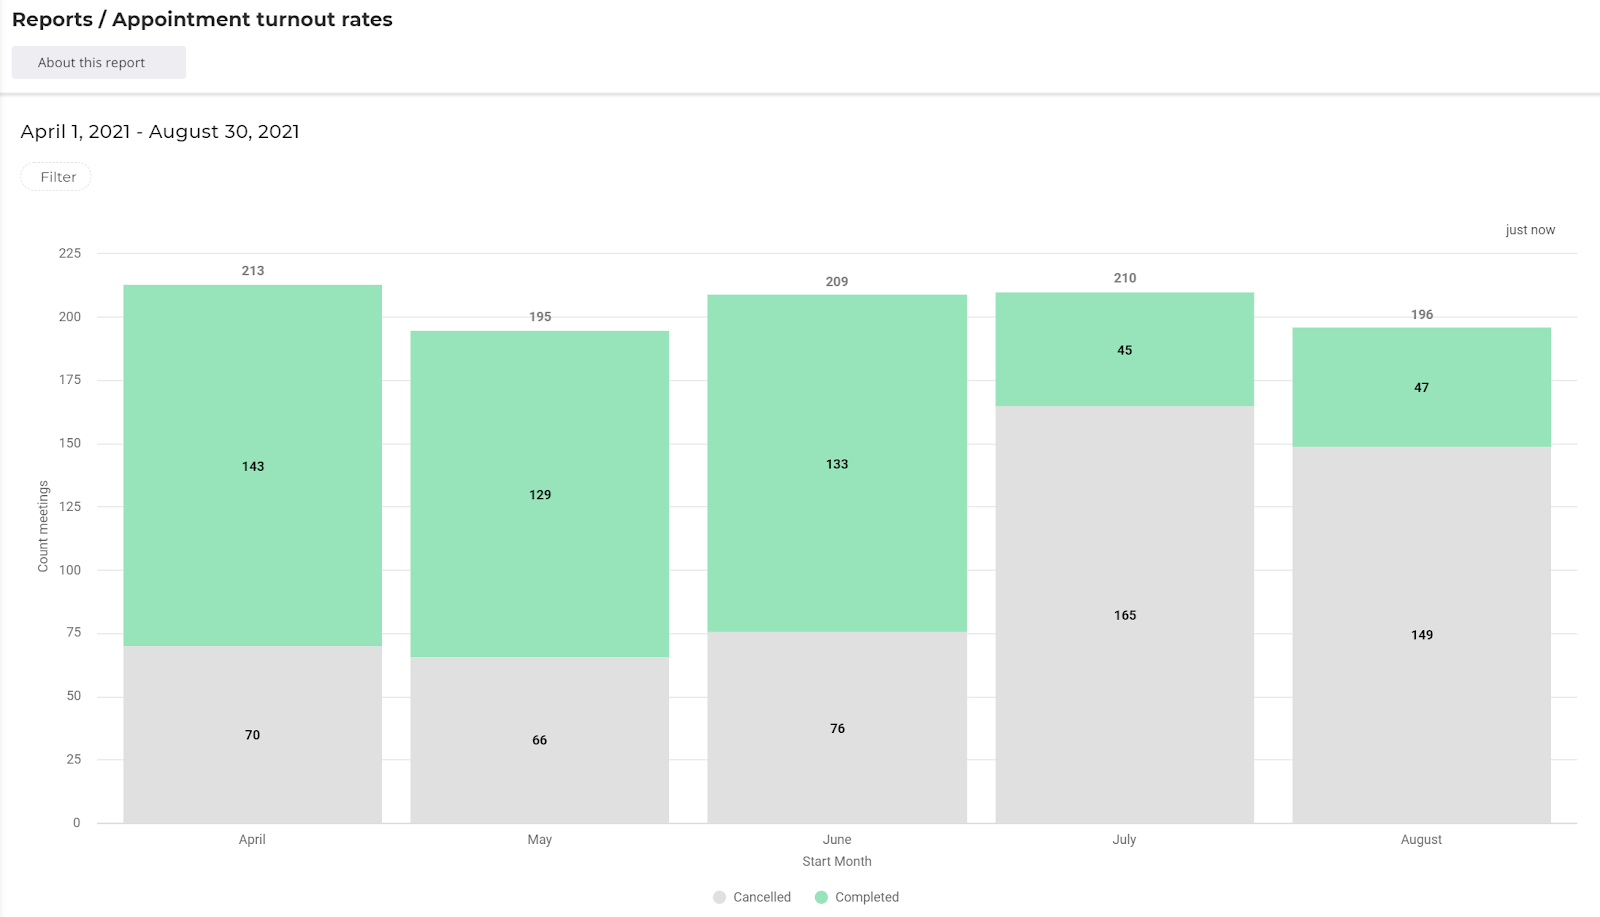
Appointment turnout rates
This report lets you know the turnout rate of your appointments, completed vs canceled. Click on the statuses in the key to filter them out.
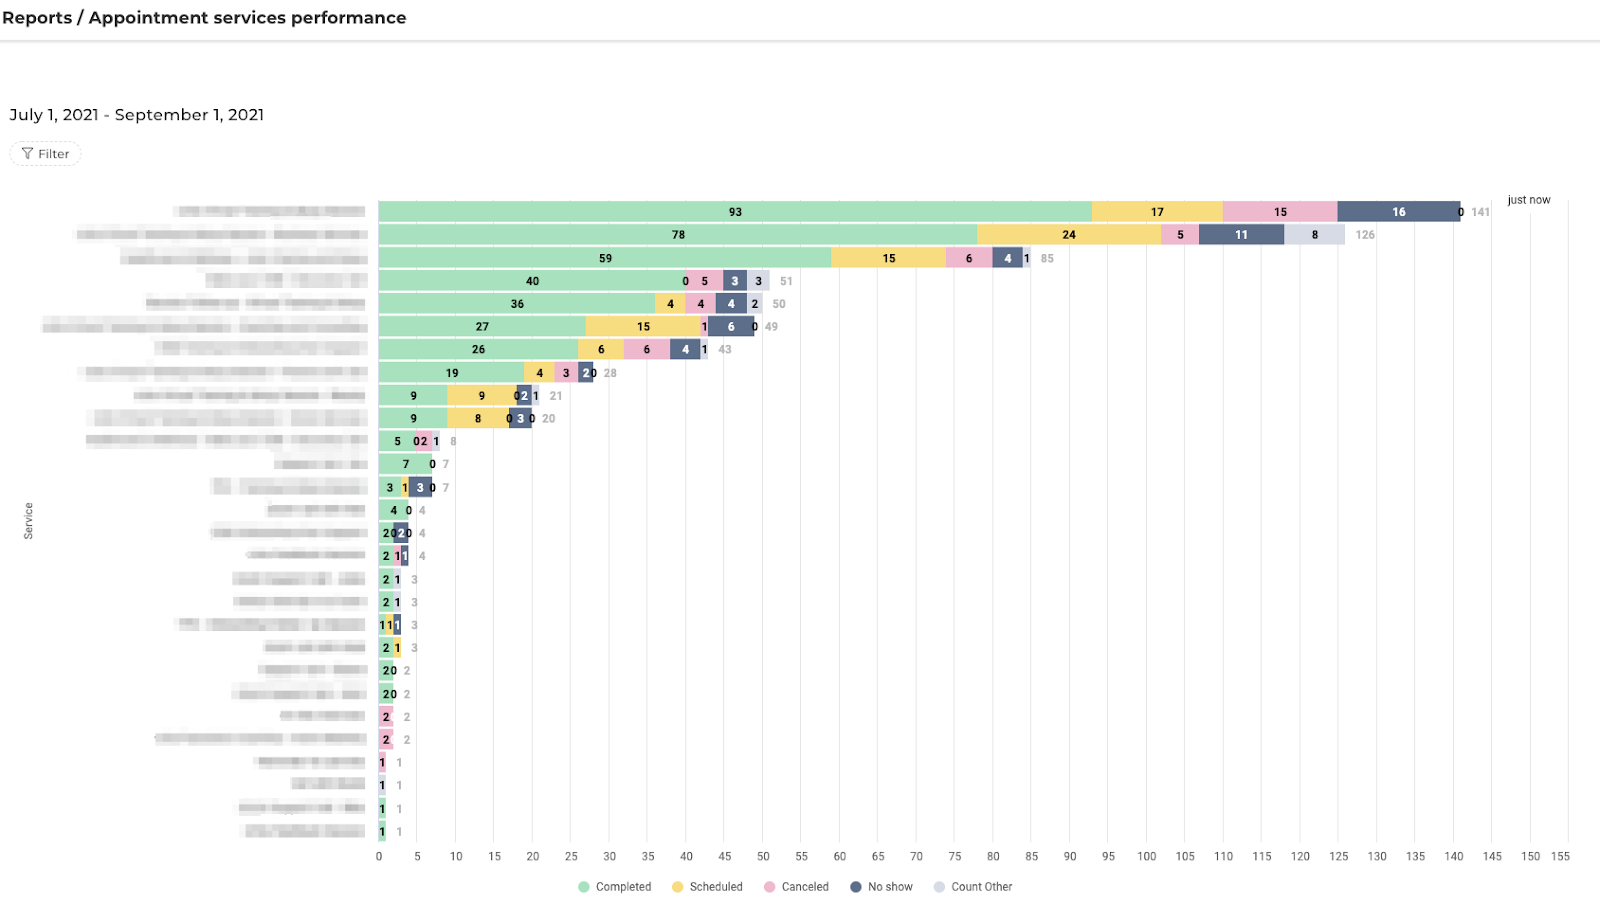
Appointment services performance
This report gives you the distribution of appointments over your services and splits them up by appointment status. This will let you know which services you offer are the most popular. Click on the statuses in the key to filter them out.
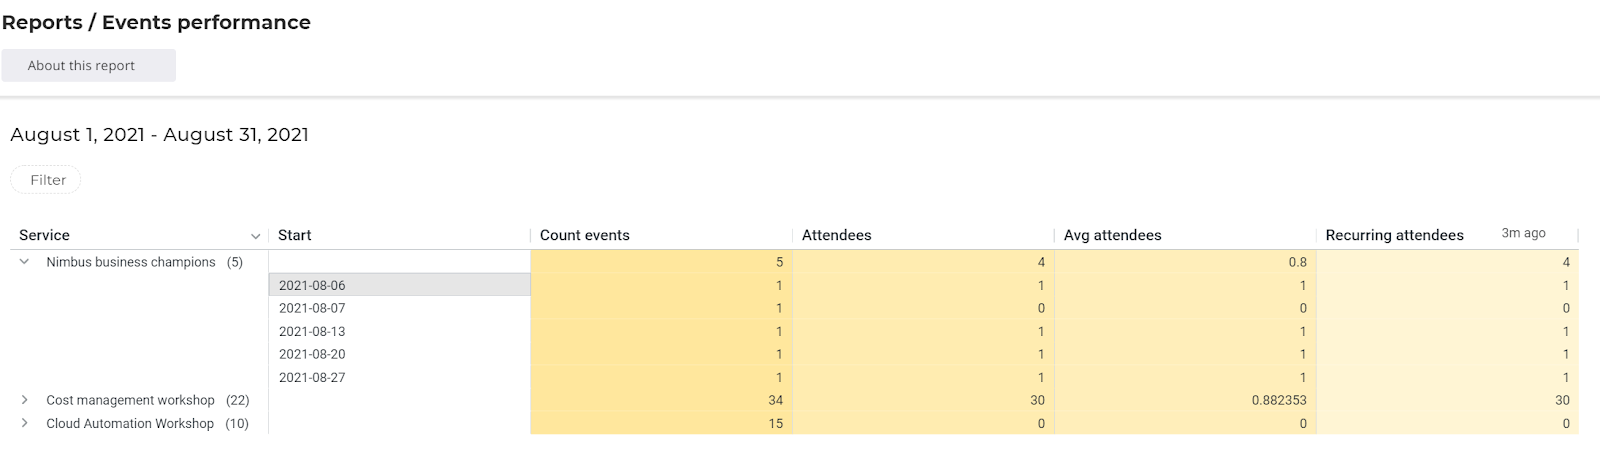
Events performance report
This report summarizes your events and turnout rates and compares the popularity of different events.
| Field | Description |
| Service | Name of the service |
| Start | Click on any service to view the start date of the individual events included in the summary |
| Count events | Total number of events |
| Attendees | Total number of attendees |
| Avg attendees | The average number of attendees per event |
| Recurring attendees |
The number of attendees who have previously attended an event of this service type |
Payment Reports
Payments reports will give you perspective on your business income and the activities that drive income.
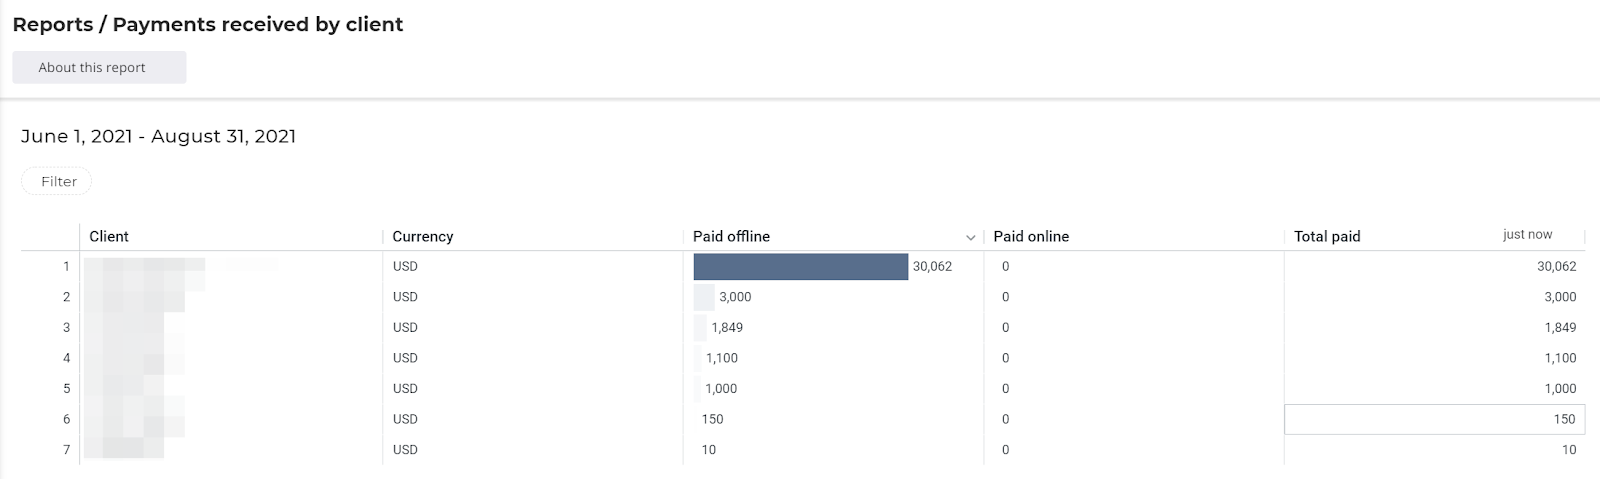
Payments received by the client
A breakdown of payments received from individual clients.
| Field | Description |
| Client | Name of the client |
| Currency | Currency of the payment |
| Paid Offline | Payments that were not processed online through the platform - like recorded payments or payments synced through integrations |
| Paid Online | Payments processed via through an integrated gateway like Square, PayPal and Stripe |
| Total Paid | The total amount of payments taken |
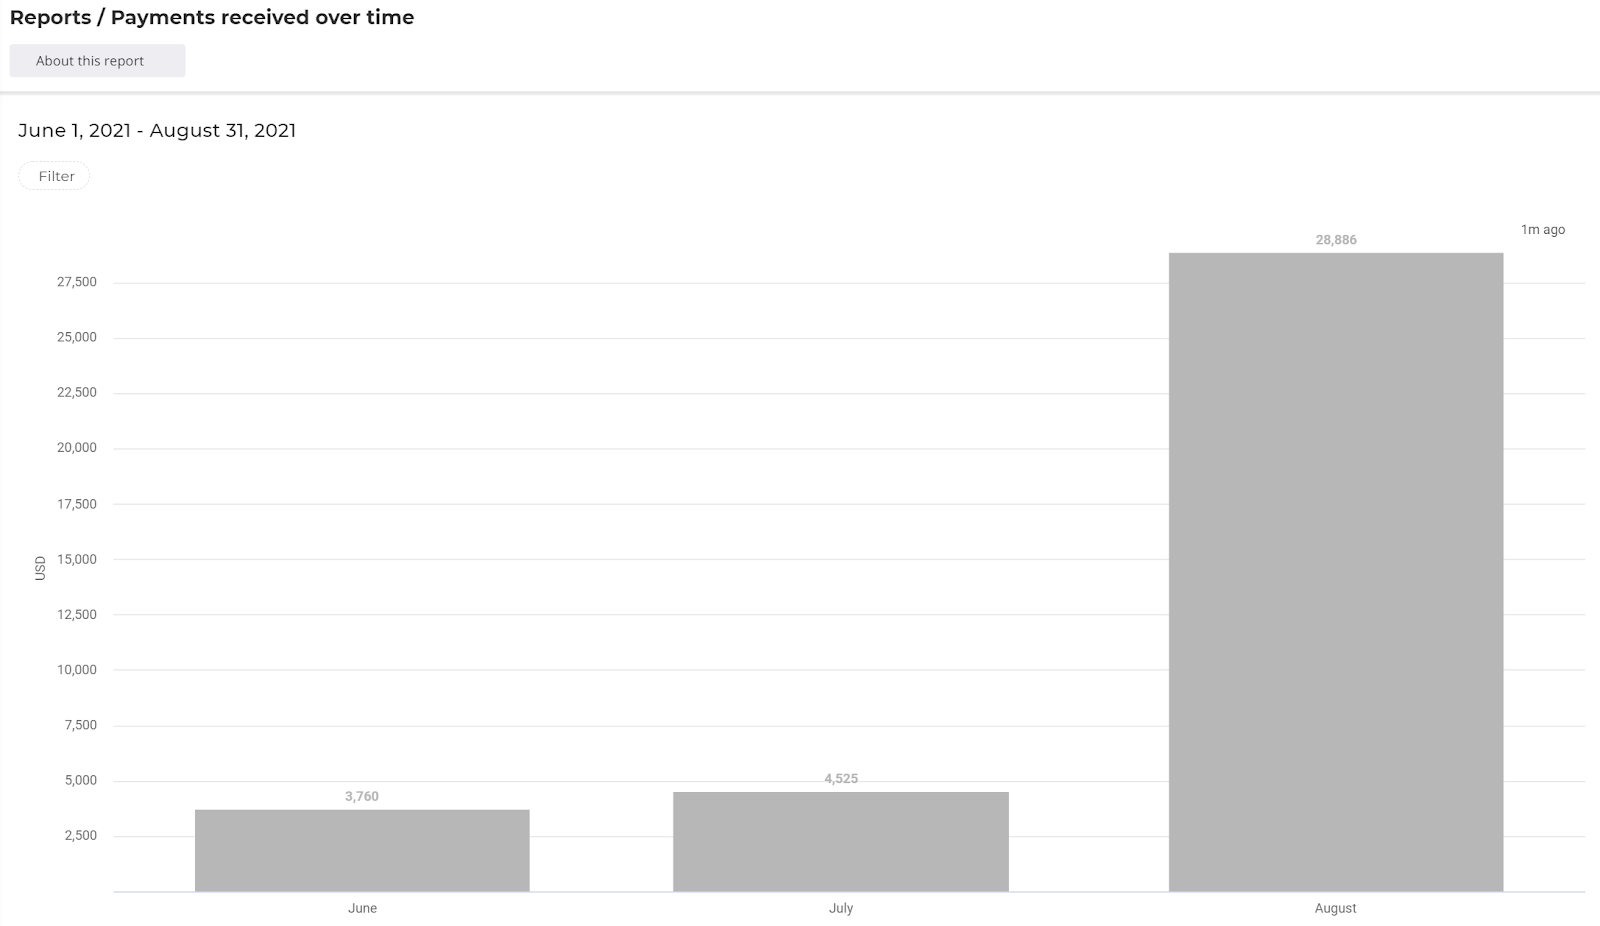
Payments received over time
This chart compares trends in revenue over time.
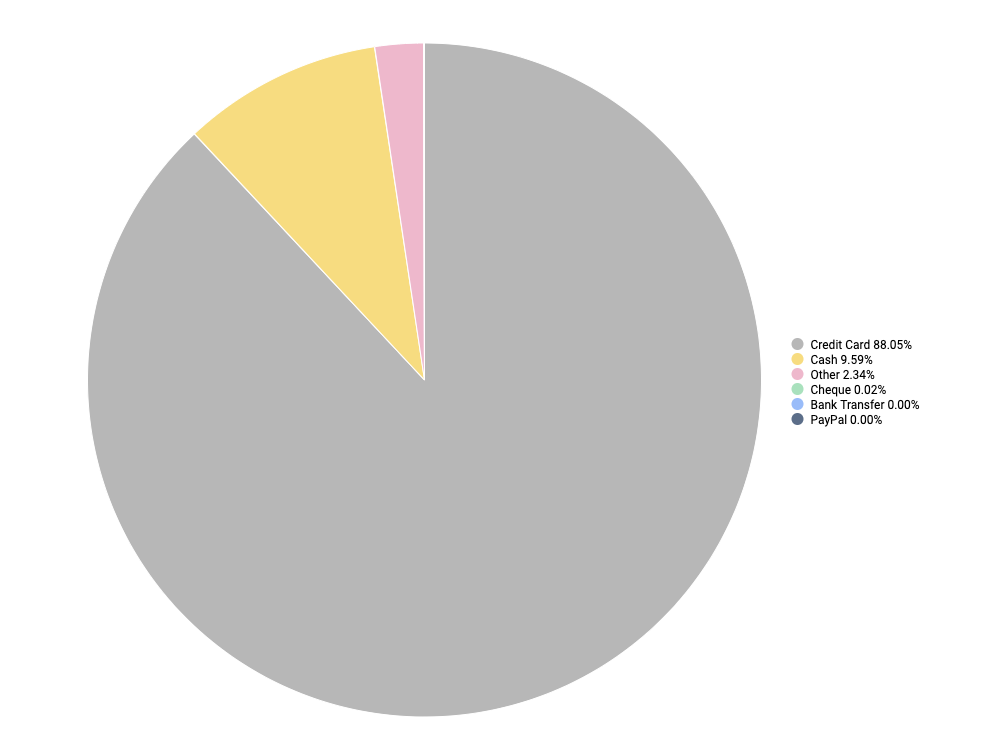
Payment Method Distribution
Use this pie chart to view your income by payment method and understand how your clients pay over time by credit card, cash, Paypal, etc.
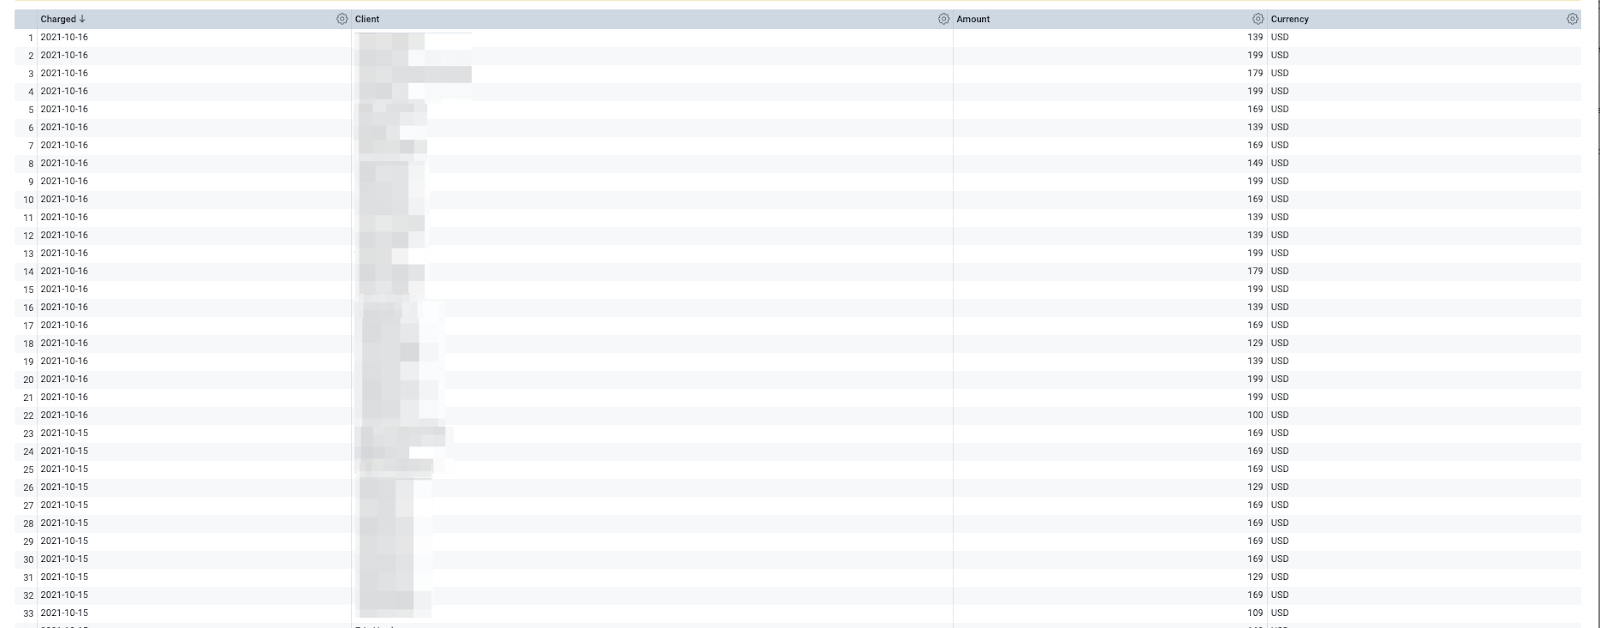
When you click on any payment method in the chart, you will be given a detailed table for all payments received by that method:
| Field | Description |
| Charged | The day the transaction was charged |
| Client | Name of the client |
| Amount | The amount charged for the service or product |
| Currency | Currency of the payment |
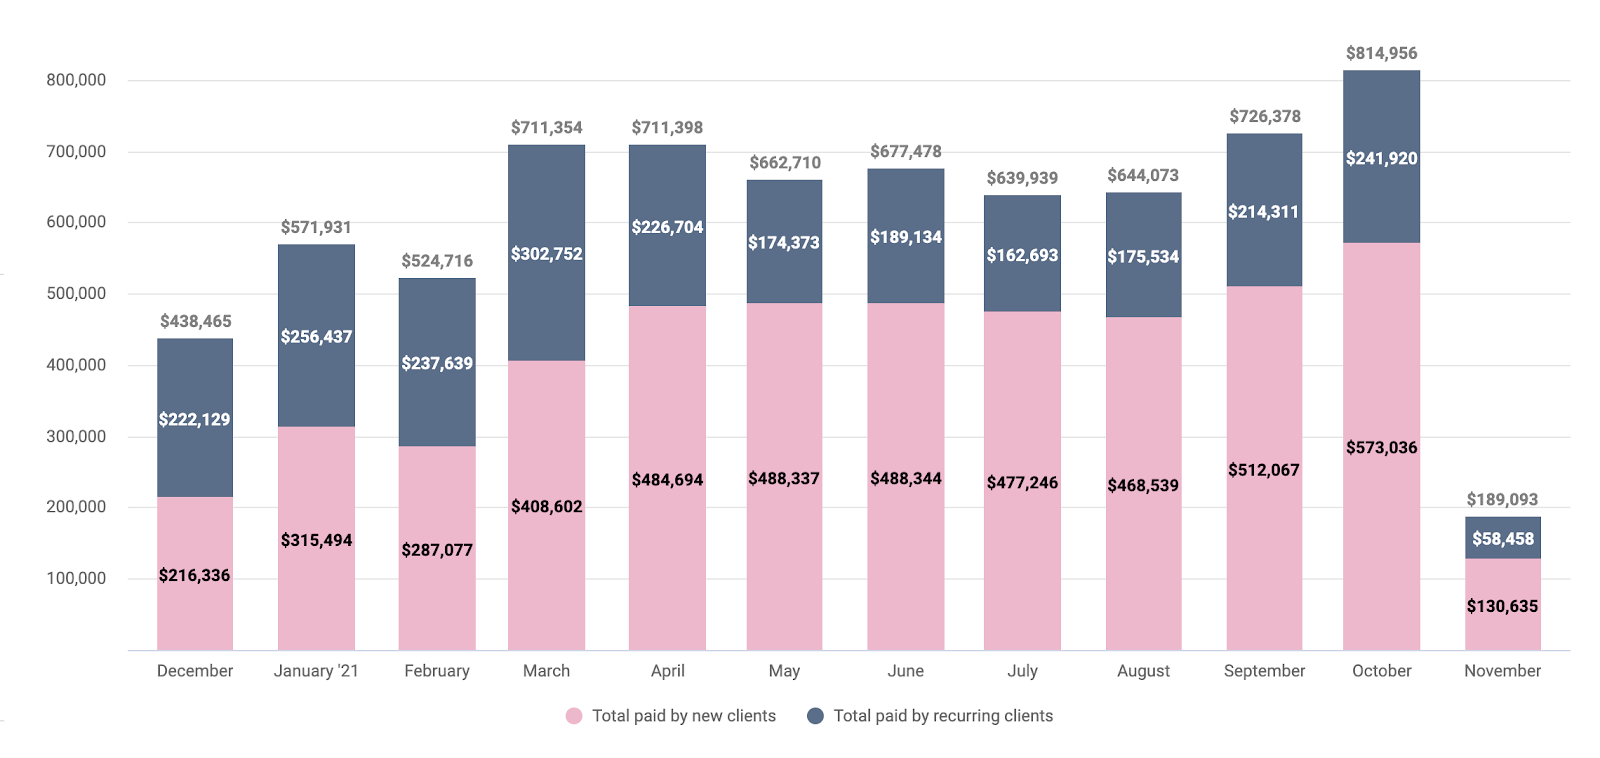
New vs Returning Clients
Use this chart to view and compare your income from one-time and returning clients. This will help you quickly see the revenue from your new and returning clients and understand where you can focus your efforts!
Clients Reports
Clients reports will help you analyze client sources and status clients, so you can better understand your top sources and sales funnel.
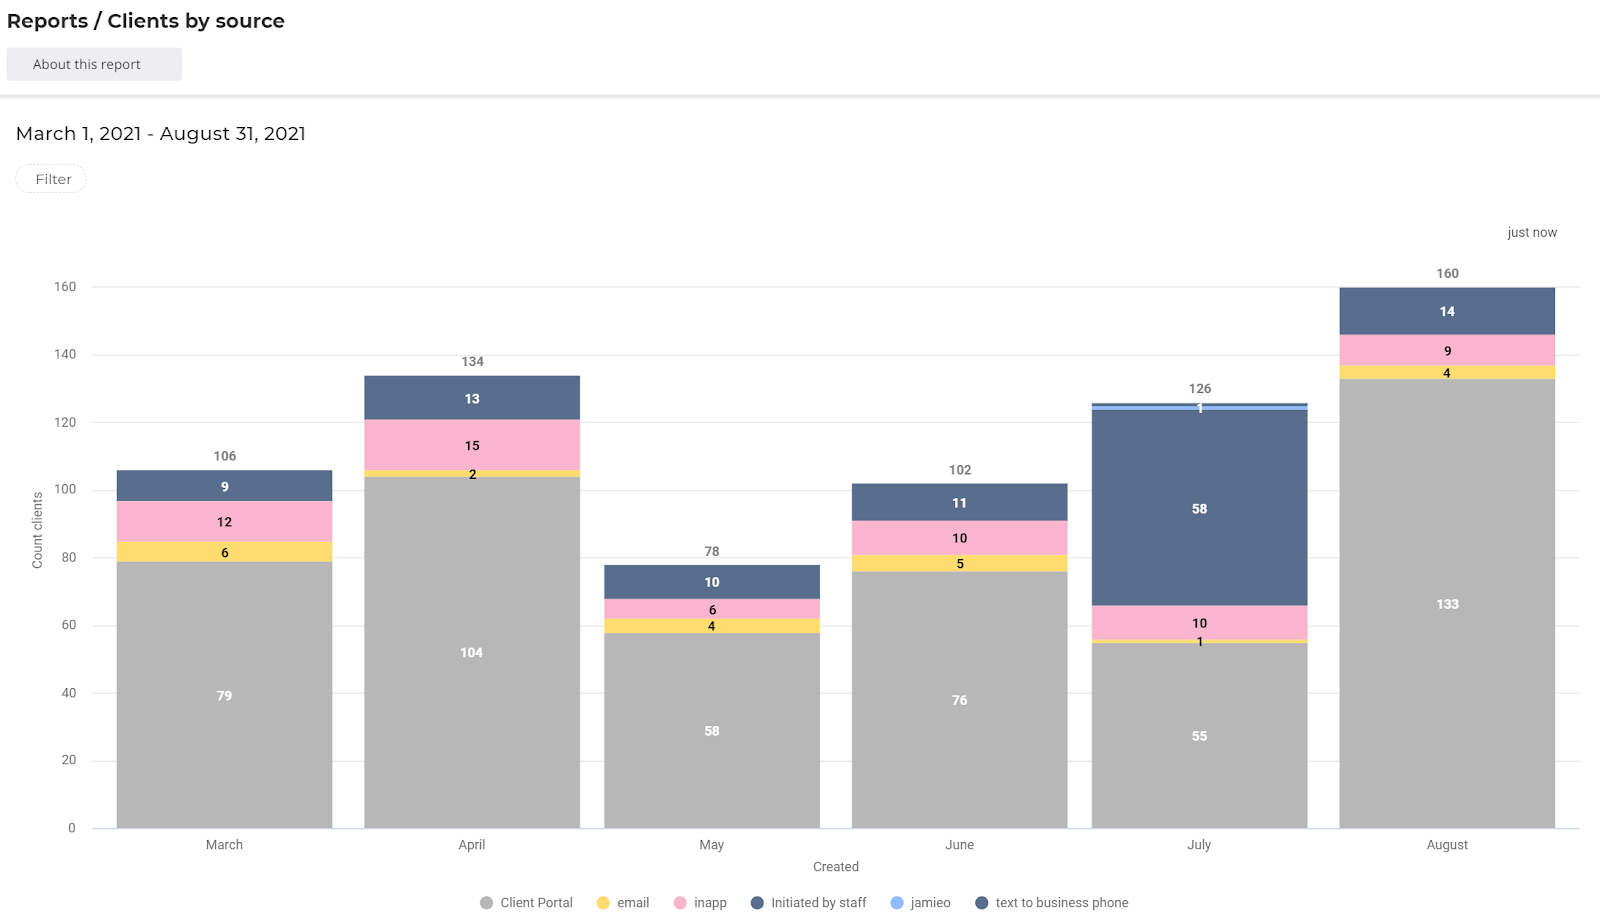
Clients by source
Find out which channels get you the most leads! This chart breaks down the number of clients you gain monthly and the sources they come from. If you use any custom sources, they will also be listed here. Click on sources in the key to filter them out.
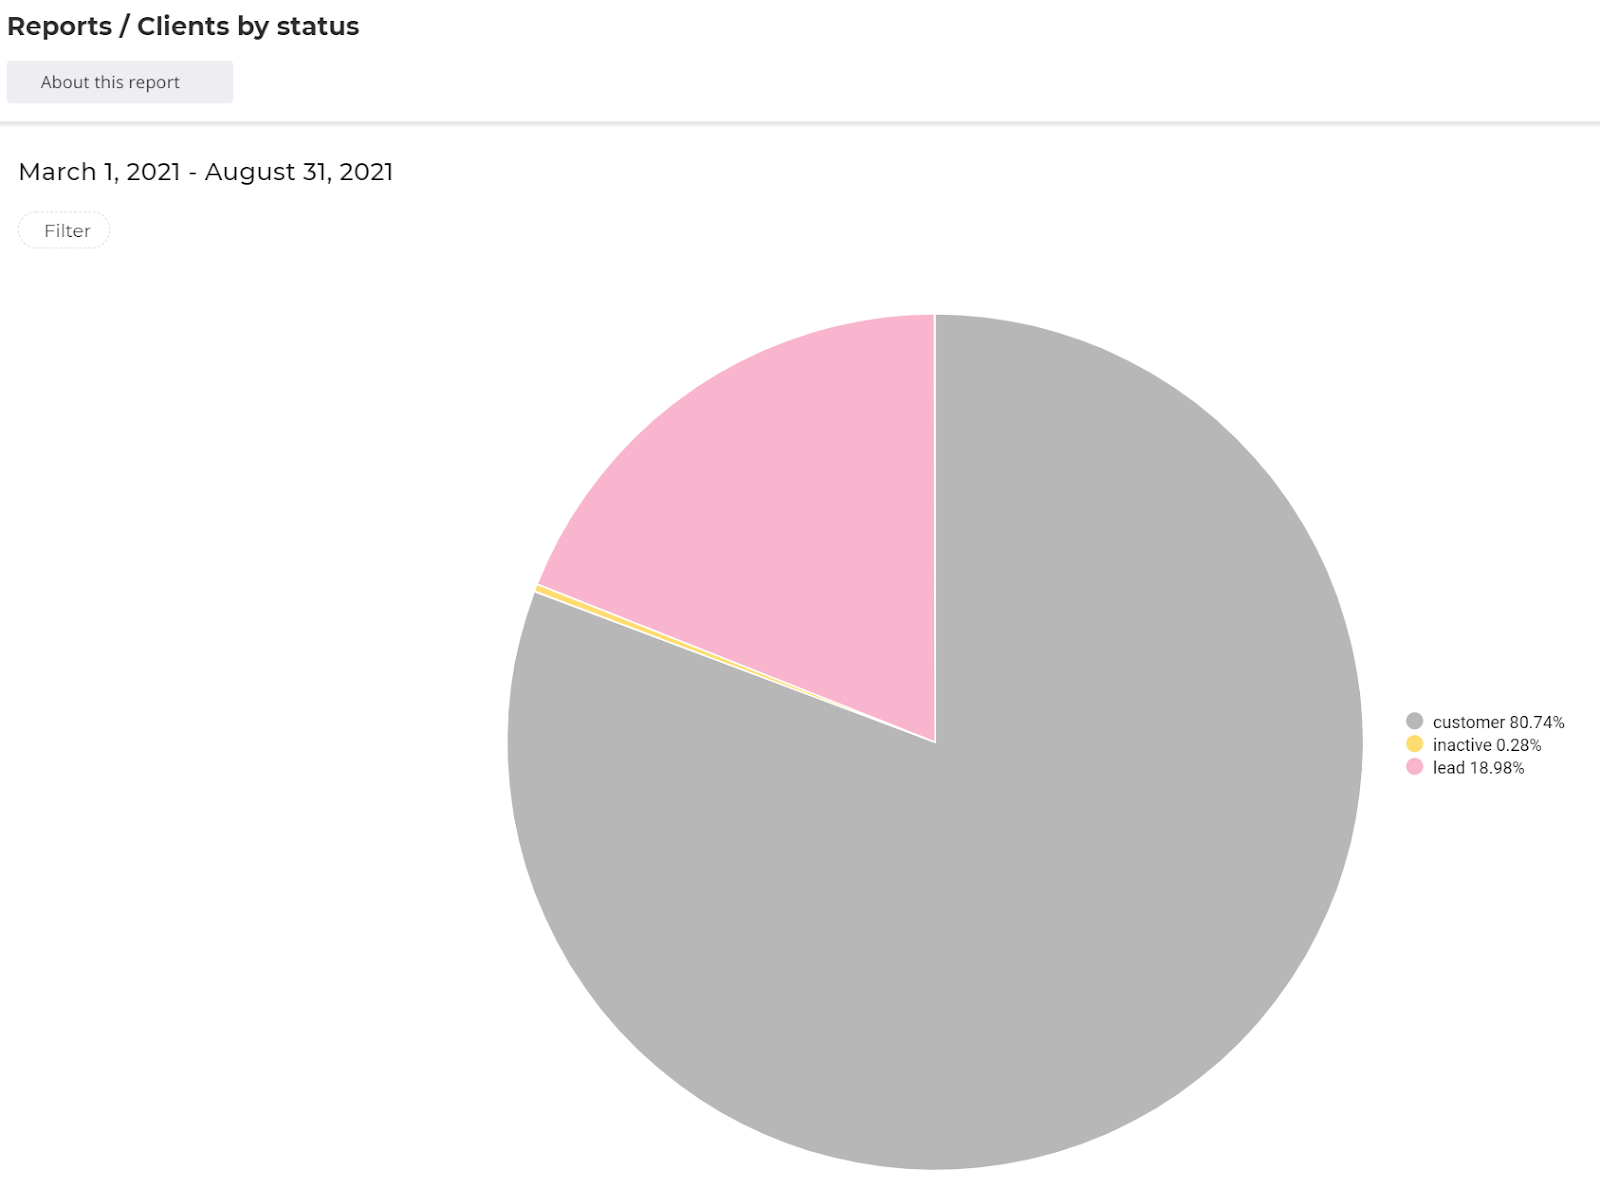
Clients by status
This chart gives you the breakdown of clients by status. If you use any custom statuses, they will also be listed here. Click on sources in the key to filter them out.
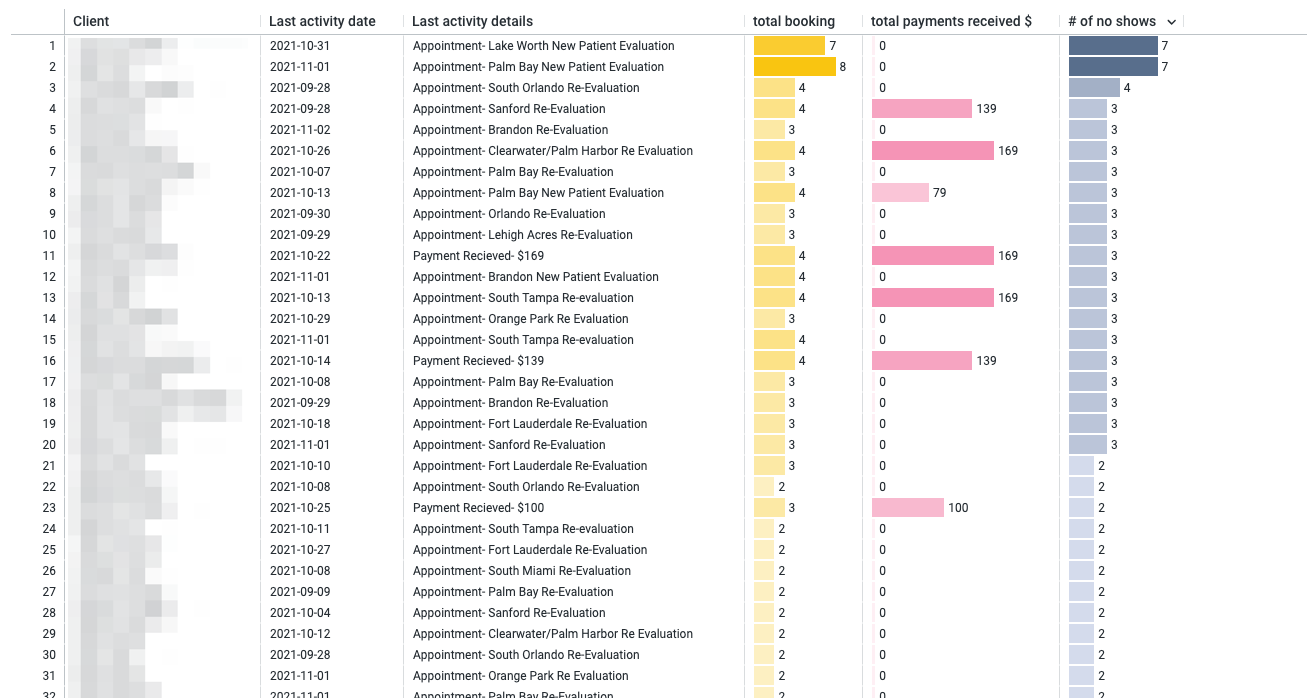
Client's Last Activity
This table shows each client's most recent activity with you.
This can benefit you in many areas, such as who is your most active client - maybe for their loyalty, you can give them a package deal or a coupon. You may be curious about the type of appointments your clients continue to book, and you want to provide more services to keep your regulars coming back! Or, on the other end, you are calculating those who have no-showed and spruce up your booking policy.
The table below shows an example of how you would view your client's last activity with you. You will see the client's name, their last activity date, the last details, how many bookings, total payments received, and the number of no-shows.
Note: Last activity details are not filtered by time but are a client property, such as an appointment type or payment.
| Field | Description |
| Last Activity | This will show the last activity with that specific client, either as an appointment or payment. |
| Total Booking | This will show how many bookings that client has booked |
| Total Payments | This will show how much revenue the client has gained for your business |
| Total No Shows | This will show which client has had the most no-shows with you |
Marketing Reports
Marketing reports will help you analyze and compare the performance of your promotional campaigns.
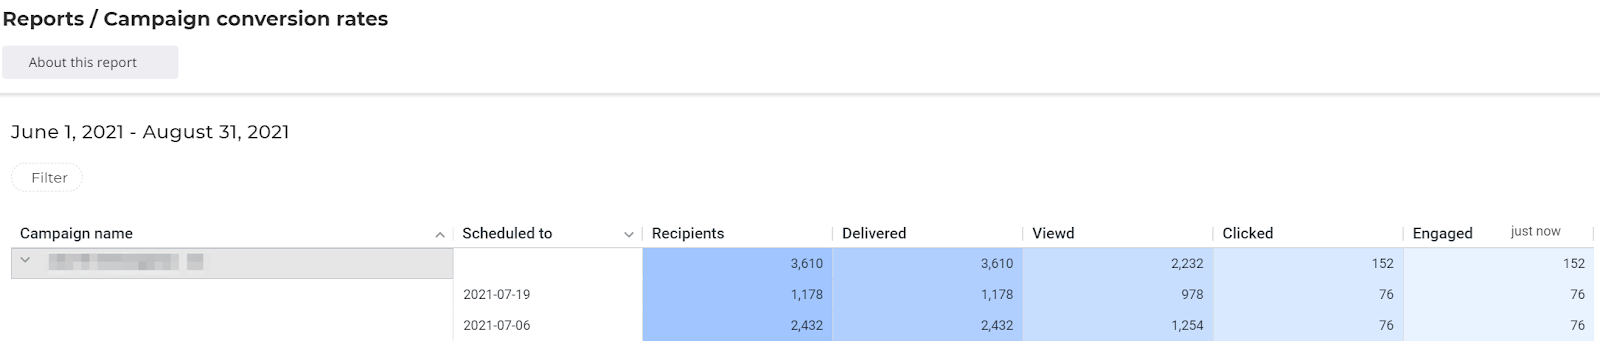
Campaign conversion rates
The conversion rates report shows how effective your campaigns have been in engaging clients. Click on a campaign name to see stats on individual sends and the number of times it was sent.
| Field | Description |
| Campaign name | The name of the campaign |
| Scheduled to | Click on a campaign to see individual sends and when they were scheduled. |
| Recipients | Number of selected recipients |
| Delivered | Number of recipients that the message was successfully delivered to |
| Viewed | Number of times the campaign was viewed |
| Clicked | Number of times the campaign CTA was clicked on |
| Engaged | Number of times the campaign CTA was completed (like scheduling an appointment) |
Note: You can also view marketing stats under Marketing > Delivery history.
Staff Reports
Staff reports will give you insight into the performance of individual staff members. You will see which staff members deliver the most services and interact with the most clients.
Staff performance
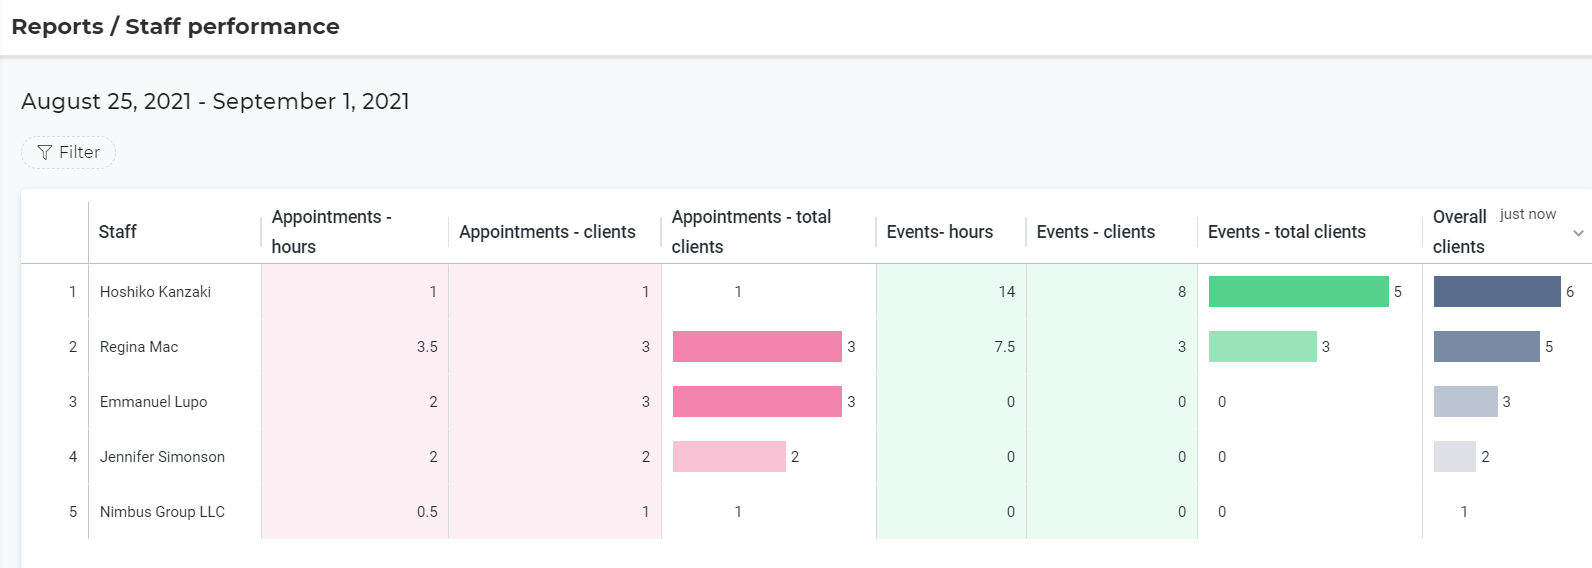
| Field | Description |
| Staff | The name of the staff member |
| Appointments - hours | Total time of appointments in hours |
| Appointments - total clients | Number of clients that the staff member had an appointment with |
| Appointments - unique clients | Number of unique clients the staff member had an appointment with (ignoring multiple sessions booked by the same client) |
| Events - hours | Total time of events in hours |
| Events - total clients | Total number of clients who attended the staff member's events |
| Events - unique clients | Number of unique clients who attended the staff member's events (ignoring multiple bookings by the same client) |
| Overall clients | The total number of clients the staff member integrated within appointments and events |